AXI releases 3D mapping for project and portfolio impact
Newly integrated 3D data visualization and mapping tools from Mapbox bring granular community impact reporting down to the State Senate, Assembly, and municipal district level.
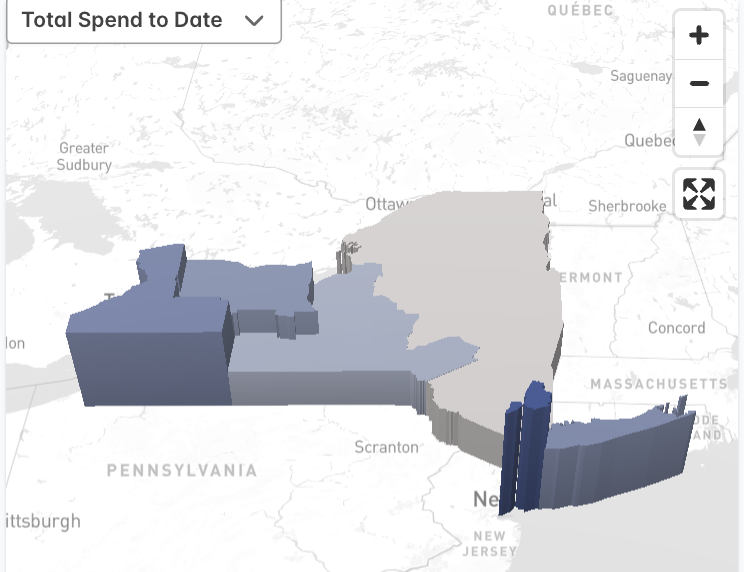
AXI has launched newly integrated 3D data visualization and mapping tools, powered by Mapbox, across the platform. The new module makes granular data insights available for each project, the overall portfolio, and the community impact of every contract and worker.
Users can now visualize the activity of every project, contractor, and individual worker down to the State Senate district, Assembly district, City Council district, and other municipal-level boundaries.
Reporting community impact to internal and external stakeholders
The 3D mapping tools were built in direct response to client requests. Compliance leaders, program directors, and executive sponsors want to see the effect their programs have on the communities they serve — and they want to report that effect to internal leadership and to external stakeholders, including the public and elected officials.
The new mapping module produces visualizations that can be exported directly into Board-ready impact reports, with no manual data preparation. It joins AXI's existing reporting toolkit and is included in the standard platform license.